
Projects
Example Reports
NOISE AND VIBRATION SURVEY OF UNDERGROUND TRAINS, SW7
Scope of Report
To factually present the levels of noise and vibration measured at a number of properties before and after improvement works being undertaken on the nearby underground railway line.
1. INTRODUCTION
1.1 Members of the ... have complained about noise and vibration from nearby underground railway lines.
1.2 London Underground have agreed to undertake improvement works on the track that they claim will reduce the levels of noise and vibration experienced in the nearby houses.
1.3 Civil Engineering Dynamics were instructed by the ... to undertake measurements of the noise and vibration in a number of properties. Measurements were made before and after the improvement works were completed, in order to assess the improvement, if any, that has been achieved.
2. THE SITE
2.1 The site and location of the underground railway are shown in Figure 1.
2.2 The buildings are large terraced houses with at least three floors and a basement.
2.3 Underground trains pass beneath at least once every three minutes during the day, but are significantly more frequent at peak times, when there is an almost constant passage of trains.
3. MEASUREMENT PROCEDURE
3.1 The client chose six houses for the measurements.
3.2 Where possible, vibration measurements were made in the basement of each house. Simultaneous measurements were made in the midspan, and at the edge, of a floor.
3.3 Ten samples of vibration acceleration were taken at each house, for ten different train pass bys. Each sample was 3.2 seconds long.
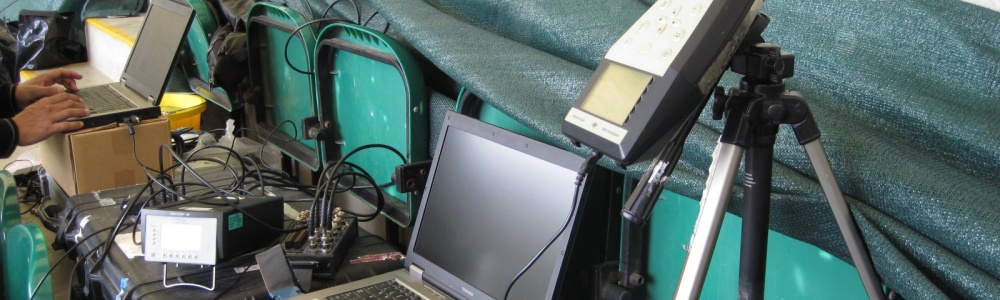
3.4 Measurements were made using a Diagnostics Instruments Di2200 Portable FFT Analyser and two Bruel and Kjaer 4399 Deltatron Accelerometers. The accelerometers were attached to a metal plate using magnets. The base of the plate was fitted with three metal spikes that stuck through the carpet to permit coupling with the floor.
3.5 Levels of noise were measured in terms of LAmax (dBA) and noted by our engineer.
3.6 Measurements were made at each property at the following times.
|
|
|
|
|
|
|
|
|
|
|
|
|
|
|
|
|
|
|
|
|
|
|
|
|
|
|
|
|
|
|
4. RESULTS
4.1 A series of one second running r.m.s. were taken for each of the samples of train vibration. Table A summarises the results from the two surveys. The maximum one second running r.m.s. for all train events at a particular location is expressed.
4.2 Noise is expressed as the maximum LAmax reading taken at each location.
Table A: Survey Results
| Location | Before | After | ||
|
|
|
|
|
|
|
|
|
|
|
|
|
|
|
|
|
|
|
|
|
|
|
|
|
|
|
|
|
|
|
|
|
|
|
|
|
|
|
|
||
4.3 The measurements show a decrease in noise and vibration at most properties. However, the vibration is still clearly perceptible at most properties.
4.4 It is important to note that some measurements were made at slightly different times of the day. Measurements made during rush hour are likely to be higher than those made during off peak hours, due to the increased weight of the trains.
4.5 These measurements are a sample of trains on two days. Train vibration is a complex subject, and the measured vibration will be dependent on a number of parameters. These include the weight and speed of the trains (that may fluctuate between trains), and the track conditions.
5. CONCLUSIONS
5.1 A decrease in noise and vibration was measured at most properties.
5.2 The vibration is still perceptible at most properties.
5.3 An increase in vibration was measured at. ...