
Projects
Example Reports
NATURAL FREQUENCY OF CONTROL TOWER - ...
Scope of Report
The aim of this survey was to determine the natural frequency of the new air traffic control tower at the ...
1. INTRODUCTION
1.1 A new air traffic control tower has been built at...
1.2 Civil Engineering Dynamics were instructed by ... to undertake a vibration survey to determine the natural frequency of the tower.
2. THE SITE
2.1 The surrounding land is essentially flat for some distance.
2.2 The control tower is approximately 50m high. The lower part of the tower is concrete and approximately 7m diameter. The cab is approximately 12m diameter.
3. MEASUREMENT PROCEDURE
3.1 The survey intended to measure the motion of the top of the tower due to wind excitation. The tower is assumed to move as an inverted pendulum.
3.2 The survey was undertaken on 19th January 1999. The wind speed and bearing for that day is shown in Table A. It is seen that the wind direction is in the same direction as the measurement axis (L) throughout the measurement period.
TABLE A: WIND SPEED AND BEARING
Time Bearing Wind Speed (Knots) 11:50 200 19 12:20 200 20* 12:50 200 19* 13:20 200 20 13:50 210 21 14:20 210 17 14:50 210 15 15:50 220 11 16:20 220 11 17:20 220 14 17:50 210 10 *Gusting 30 Knots
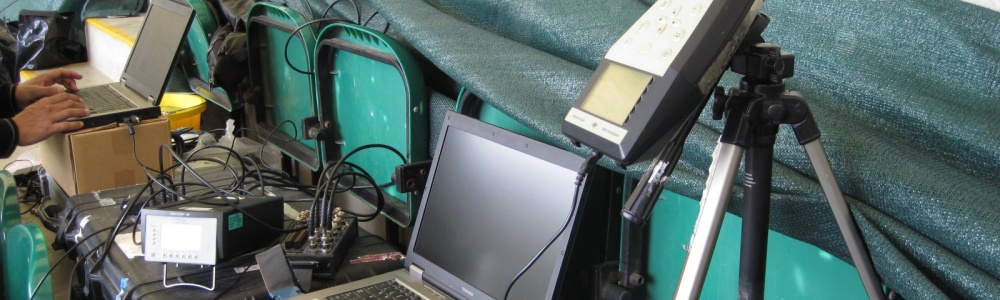
3.3 Two Bruel & Kjaer 4378 accelerometers were used to record the acceleration in two horizontal directions. One accelerometer was orientated in the direction of the wind (L), the other at right angles to it (T). A Diagnostic Instruments Di2200 real time FFT analyser recorded the signals from both locations simultaneously.
3.4 The accelerometers were fixed to the inside of the concrete shaft. The measurement locations are shown in Figure 2. 'L' was orientated approximately south-south-west, 'T' approximately east-south-east.
3.5 A further test was undertaken where one accelerometer (L) remained at the top of the tower while the other was fixed to the inside of the concrete shaft at the base of the tower, orientated in the same direction. The purpose of the second test was to confirm that the movement measured at the top of the tower corresponded to the first mode of the tower.
3.6 The vibration signals were low pass filtered using the vibration analysis program HV Lab, and displayed using Matlab.
4. RESULTS
4.1 Sample waveforms are shown in Figures 3 - 5.
4.2 Figure 3 shows unfiltered waveforms.
4.3 Figure 4 shows the same waveforms after a low pass filter at 5 Hz has been applied.
4.4 Analysis of 27 pairs of measurements, made throughout the afternoon, concludes that the natural frequency of the tower is 0.9 - 1.0 Hz.
4.5 Figure 5 shows a simultaneous measurement at the top and the base of the tower. The motion of the top of the tower is the same as before, the measurement at the base shows ambient vibration. From this we conclude that the measurements made at the top of the tower correspond to the first mode of motion of the tower.
5. CONCLUSIONS
5.1 Our measurements show that the natural frequency of the tower is 0.9 - 1.0 Hz.