

Projects
Industrial Sponsorship
Dynamic Performance Investigation of Base Isolated Structures
By Ather K. Sharif
5.1 Theory of Isolation (SDOF model)
Base isolation is traditionally evaluated using a single-degree-of-freedom (SDOF) model (position completely described by a single co-ordinate). Mass, stiffness and damping properties are each assumed to be concentrated in a single element, as shown in Diagram 5.1(a). A theoretical description of a damped SDOF system to a harmonic force are well known (see for example Den Hartog, 1934; Meirovitch, 1986; Clough and Penzien, 1993; Harris, 1995, Newland, 1989).
An expression of the equilibrium of all the forces on the mass in Diagram 5.1(b) can be used to write an equation of motion from Newton's 2nd law.
There is an elastic resistance to displacement, provided by a weightless spring k, which acts in a direction opposite to the displacement. There is a damping force proportional to velocity, when provided by a viscous damper, and acts in a direction opposite to the velocity of motion. A mass develops an inertial force proportional to its acceleration and opposing it (d'Alembert's principle). We can write eqns. 5.1-3:
Because displacement u(t) is referenced from static equilibrium position, effect of gravity can be ignored in the equation of motion (spring force due to static displacement 'cancels' with weight of rigid body).
Diagram 5.1 described a situation where a mass is acted upon by a dynamic load p(t). Yet in a base isolation application, it is motion of the support (ug(t)) which leads to a response of the mass (U(t)) that is of interest as described in Diagram 5.2.
Equilibrium of forces for this case gives:
![]()
Noting that U(t) represents absolute displacement, and ur(t) relative displacement
Equation of motion in terms of two variables U(t) and ur(t) is:
![]()
Using eqn. 5.6, we can rewrite this as:
![]()
Since ground acceleration represents dynamic input to mass, it is convenient to write
![]()
Eqn. 5.10 is similar to eqn. 5.4. Therefore a mass acted upon by a direct load p(t) is similar to support motion, which leads to an effective load peff (t).
We could alternatively write eqn. 5.8 as:
![]()
![]()
The term kug on the R.H.S. of eqn. 5.12 explains the intuitive idea that elastic support using a softer spring can reduce the effective loading on a mass due to a given ground motion.
Returning to eqn. 5.4, it has been shown that p(t) can be used to represent a load applied directly, or an effective load resulting from support motion. If we assume in the first instance that there is no applied load, we can obtain the free vibration response, obtained as a solution of the homogeneous differential eqn. 5.13:
![]()
We can assume a solution of the form:
![]()
Substituting 5.14 into 5.13 gives after dividing by m and Zest and introducing the notation w n2 º k/m (where w n is the natural frequency) the characteristic equation:
![]()
Whilst a solution with zero damping are instructive (see Meirovitch, 1986), we proceed with a damped system for brevity, and characteristic equation has solutions:
![]()
![]() Three types of motion are described, according to whether the quantity under the square root sign is zero (critically damped), positive (over critically damped), and negative (under critically damped). The condition of critical damping arises when:
Three types of motion are described, according to whether the quantity under the square root sign is zero (critically damped), positive (over critically damped), and negative (under critically damped). The condition of critical damping arises when:
Damping coefficient c is now referred to as critical damping coefficient cc = 2mw n
A critically damped condition represents the smallest amount of damping for which no oscillation occurs in free vibration response (i.e. mass from displaced position returns asymptotically back to zero). For an over-damped system, the asymptotic return to zero is slower, according to the amount of damping. Neither of these cases are of real interest here, which leaves the under critically damped condition (c<cc).
It is convenient to express damping in terms of critical damping ratio x :
![]()
Substitute eqn. 5.18 into 5.16, gives:
![]()
![]()
Which from eqn. 5.14, and the two values of s in eqn. 5.19 gives:
![]()
The terms in the square brackets can be depicted as vectors rotating counter clockwise and clockwise with angular velocity w D and the magnitude of the vectors decay exponentially with time on account of the term outside the square brackets. For the response u(t) to be real, Z1 and Z2 are complex conjugates, and the imaginary components of the two vectors cancel each other (see Clough and Penzien, 1993).
Eqn. 5.21 can be expressed in equivalent trigonometric form using Euler's transformation e± iq = cosq ± isinq .
Length of vectors diminish exponentially in accordance with term e-x w nt of eqn. 5.24. This rotating vector representation can be shown as a time history by projecting the rotating vector on to the real axis (or imag axis).
Returning to eqn. 5.4, we can assume a harmonically varying load p(t) of sine wave form, with amplitude po and driving frequency w . Divide by m and note that c/m=2x w n gives:
![]()
The complementary solution of the homogeneous form of this equation is the damped free vibration response given by eqn. 5.22. The particular solution is of the form:
![]()
Substituting eqn. 5.28 into 5.27 and separating into cosw t and sinw t terms gives two simultaneous equations providing expressions for G1 and G2, which can be substituted into eqn. 5.28.
The total response is given as the sum of the complementary solution and the particular solution (frequency ratio l =w /w n), using the principle of superposition.

The constant A and B of the complementary part of this solution (first term) can be evaluated for any initial conditions of displacement and velocity. However it represents the transient response, which damps out according to e-x w nt and therefore is of less interest here. The second term represents the steady state harmonic response. We can express the second term of eqn. 5.29 as:
![]()
In which
![]()
![]()
The dynamic magnification factor M, is defined as the ratio of harmonic response amplitude to static displacement produced by the force po.
![]()
The magnification factor (M) and the phase angle (f ) are shown in Figure 5.1 and Figure 5.2, for various values of damping ratio x . The frequency at which maximum displacement response occurs (resonance frequency), is not at the undamped natural frequency w n, but at a frequency slightly less than this according to eqn. 5.34. Whereas velocity response peaks at w n and acceleration response peaks at a frequency slightly above w n (see Blake , 1995). For low values of damping these differences may be ignored.
![]()
To help understand Figures 5.1 and 5.2, it is instructive to examine the motion and force vectors, which are assumed as the Real or Imaginary components of the complex form (eiw t), shown in Diagram 5.4.
The actual motion and forces arise by resolving the complex vector into real or imaginary components according to convention adopted for applied dynamic load. All the motion and forces arise in the degree of freedom direction (u). The phase relationship of the vectors are shown for one snapshot of time and frequency ratio l .
At low frequencies, the damping and inertia forces are negligible so that po » kG , with phase angle f » 0. At very low frequencies this is effectively the static case, where response is controlled by stiffness.
With increasing frequency, the damping force grows (cw G ), but the inertia force (mw 2G ) grows still faster. The phase angle must increase to cause the applied force po to balance cw G . The inertia force vector will grow until it balances the spring force, at which point the phase angle must be 90° such that po= cw G . Energy introduced into each cycle from the applied force is matched by the energy taken out of the system through damping as heat. This happens when the applied frequency equals the natural frequency (resonance) because mw n2 G = kG (i.e. w n2=k/m). Response at resonance is therefore limited by damping.
Above the natural frequency inertia force vector will grow larger than stiffness force vector, such that po must now adopt a phase angle greater than 90° . For very high frequencies, spring force kG is insignificant with respect to inertia force mw 2G , so that the applied force po balances inertia force, with phase angle approaching 180° . The applied force therefore opposes motion. Response of the object is less than would have arisen in the static case, referred to as isolation, and this response is limited by mass.
We can appreciate why it is that vibration builds up when w = w n and phase angle is 90° , by reviewing the concept of work done by a harmonically varying force upon a harmonic motion of the same frequency (Den Hartog, 1934), as follows:
Referring to Diagram 5.1(a) , we can assume a force p(t) = po sinw t to act upon a mass which has a response u(t) = G sin(w t - f ). The work done by a force during a small displacement du is pdu. This can be written as pdu.dt/dt. During one cycle of vibration w t varies from 0 to 2p , and so t varies from 0 to 2p /w . We can calculate the work done during one cycle (W) as: ...
From this we can see that the component of force p(t) in phase with displacement u(t), (f =0) does no net work over a cycle. Whilst it will do work during part of a cycle, in another part of the cycle it does negative work, such that over a complete cycle zero work is done. The maximum amount of work is done over a cycle, when the force is (f = 90° ) out of phase with the displacement u(t). Hence we can see that over a number of cycles vibration will build up. We have seen that this build up reaches a limit when input energy matches energy dissipated by damping.
The forgoing related to the response of a mass subject to a direct dynamic load. In a base isolation application, it is motion of the support that leads to an effective dynamic load, as shown in eqn. 5.10, and a solution can be obtained as follows.
If we assume a harmonic support motion of the form:
![]()
Which gives an effective loading
Recall from eqn.5.33:
![]()
Substitute po max º peff max º mw 2 ugo
Using eqn. 5.30
![]()
Recall from eqn. 5.6
![]()
Which gives
![]()
Adding vectors gives:
![]()
Transmissibility is defined as amplitude ratio of mass to base motion.
![]()
This is plotted in Figure 5.3. It is instructive to examine the motion and force vectors of this situation in Diagram 5.5 (let D = ugoMsqrt(1+(2x l )2) for eqn. 5.46)
We see that positive deflection (U) leads to a force in the opposite direction on the mass, yet positive displacement ug leads to a force in the same positive direction on the mass. Vector addition of forces would give a closed polygon, for dynamic equilibrium.
![]() Note that:
Note that:
![]()
![]()
Response displacement lags behind the input displacement by phase angle y 1 given in the following equation, which is plotted in Figure 5.4, as a function of x and l .
5.2 Alternative Damping Models
The theory described so far has considered the energy loss mechanism from an ideal linear dashpot (viscous damping). Here the coefficient of proportionality 'c' for the dashpot is constant (independent of frequency), whereas the loss factor h (ratio of energy loss per radian to peak potential energy in the cycle) is given by eqn. 5.51 (Crandall, 1970).
![]()
One might choose a coefficient of proportionality 'c' (dashpot parameter) for the damper to obtain the correct loss factor at a natural frequency of the system, but the damping values will be wrong at other frequencies. A disadvantage with this model of damping is that structures do not necessarily dissipate energy as a linear function of frequency in this way. An alternative is to define a frequency dependent dashpot parameter 'c', in eqn. 5.52.
![]()
A linear hysteretic damping model assumes the loss factor h (w ) is constant (h o), independent of frequency, which can be modelled by an equivalent dashpot parameter that is frequency dependant c(w ).Hysteretic damping may be defined as a damping force proportional to displacement amplitude, but in phase with velocity (Clough and Penzien, 1993). A linear hysteretic damping model violates causality in the time domain (see Crandall 1970, 1991). Newland (1993) shows that the Magnification Factor (M) for a hysteretic damped system has a resonance peak at w n and phase angle is not zero for zero frequency.
Proportional damping assumptions are often used in Finite Element programs to uncouple second order equations that describe a multi degree of freedom system. Rayleigh damping constants allow a frequency dependent damping ratio, where the modal damping ratio x j can be expressed as :-
![]()
a represents damping proportional to the mass matrix, while b represents damping proportional to the stiffness matrix. The effect of Rayleigh damping constants on the resulting critical damping ratio is seen in Figure 5.7, where alpha (a ) damping is inversely proportional to frequency, such that lower frequencies are damped more. In contrast, beta (b ) damping is seen to cause the critical damping ratio to increase with frequency. It is possible to form two simultaneous equations using eqn. 5.53 for two modes. The total effect is a frequency dependent critical damping ratio, which is nearly linear in a particular range of interest (see Ewins, 1984; Newland , 1989). Bhaskar (1992) shows that difficulties arise in the analysis using proportional damping, when damping is highly localised, as might arise with base isolation.
The Coulomb (dry friction) model is where damping force (proportional to normal load on a shearing surface) is independent of displacement or velocity, but arises in a direction opposite to velocity of motion. Energy dissipated is simply the work done (force x distance) and therefore is dependent upon the displacement amplitude (see Meirovitch, 1986).
Radiation damping, is where energy loss may arise from elastic waves propagating from the structure and a theoretical model could adopt an equivalent viscous damper to account for this.
There are a great variety of terms used to describe damping (see Newland , 1989), and there are a variety of ways to determine damping properties (Clough and Penzien, 1993). Lazan (1968) provides a detailed study on damping. The methods to estimate damping used in this research are summarised in the next section.
5.3 Alternative Methods to Estimate Damping Properties
The alternative methods used to estimate damping ratio in this thesis are described, and the source information can be found in various texts (e.g. Ewins, 1984; Newland, 1989; Clough and Penzien, 1993).
5.3.1 Logarithmic decrement
Free vibration response can be analysed to obtain the amplitude of motion from successive peaks m cycles apart, which gives the logarithmic decrement of damping, (d ), related to critical damping ratio as follows:
![]()
Damping estimated from analysis of different sections of the free vibration record can lead to different values of damping, if this is amplitude dependent. It is therefore appropriate to estimate damping at the strain levels of interest.
Bandwidth of half power points
![]()
From a plot of the frequency response function, bandwidth of half power points is defined as the frequency interval measured between two points at the (peak /Ö 2) level (D w ). An estimate of critical damping ratio can be obtained from the following equation, for a lightly damped system:
Subscript j denotes that the calculation could be repeated for any well separated mode. This method is intended to analysis the steady state response, for which the frequency intervals of the test should be closely spaced to resolve the resonant response.
5.3.3 Nyquist Plot for Circle Fits
This method is described using a simple experiment involving a steel cantilever (Figure 5.5(a)), that is subject to a force impulse (Figure 5.5(b)), which produces a response (Figure 5.5(c)).
Figure 5.6(a) plots the real and imaginary components of the cross-spectrum (between force input and velocity output) at equal frequency intervals (Nyquist plots, due to Kennedy and Pancu, 1947), which show that in the region of resonance the arc length is a maximum and the points execute a near circle. For a viscous damping model, a Nyquist plot of mobility traces an exact circle, whilst for a hysteretic damping model it is receptance that traces an exact circle, although Bhaskar (1992) showed that which of the plots yields the best fit to a circle cannot be used to infer the damping mechanism.
The polar plot method allows damping to be estimated for nearby modes, which would be impossible to do using the bandwidth method. Damping ratios are measured by fitting the best circle through the plotted points for each resonance. However in finding the best circle fit it is unwise to use all the data points with equal weighting as the results further from the resonance point stray from a circle, and are therefore less reliable. Brandon and Cowley (1983) described a method of giving more weight to the data points near the resonance point, which involves conformal mapping using a version of the Möbius transformation, where a circle through the origin maps to a straight line under inversion. The procedure involves plotting the cross spectrum on the Z plane (see Figure 5.6(a)). The resonance point is identified from the maximum arc length. This suspected resonance point, along with sufficient points either side are shifted to the origin (Z' plane). The transformation w=1/z’ is carried out, where the data in the W-plane fall on an approximate straight line (see Figure 5.6(b) where circle denote data points). A least squares straight line fit is obtained and the reverse sequence carried out to plot the best circle in the Z plane (solid line of Figure 5.6(a)). The centre (shown as a cross) is then established and angles to points above (q a) and below (q b) the resonance are noted.
![]()
The following relationship ( Ewins, 1984) is used to estimate damping.
An exponential window was used to ensure that the Nyquist plot remains circular, and also reduces the effect of poor signal to noise ratio at the tail end of transient data. However windowing can lead to a higher value of damping, which can be corrected using the following relationship for an exponential window (Mercer et al, 1969).
![]()
A plot of critical damping ratio as a function of frequency above and below resonance is shown in Figure 5.6 (c). The small systematic variation in damping estimate could either be due to a poor experiment, interference form neighbouring modes, or non-linear effects (see Ewins, 1984). From this experiment the damping ratio is estimated as 1% of critical, and compared well against the logarithmic decrement method applied to the free vibration response of Figure 5.5 (c), which gave a damping ratio of 0.8%.
SDOF Base Isolation Models
Figure 5.8(a) shows the Transmissibility for a SDOF system typically used to predict response of a base isolation system (as a function of frequency rather than frequency ratio l of Figure 5.3). Increasing the level of viscous damping reduces the magnitude of response at resonance, although reduces the degree of isolation at higher frequencies. Figure 5.8(b) shows how the concept of Base Isolation was originally envisaged (Waller, 1969). A building was thought of as a rigid entity sitting on a soil spring. The resonance frequency of the rigid building on the soil (labelled un-isolated) is coincident with the peaks in the spectra of ground vibration from trains. The idea of base isolation was to mount the entire building, again treated as a rigid body, on softer springs to achieve a lower resonance frequency, which lay below the dominant peaks in the spectra of ground vibration from trains. Figure 5.8(b) illustrates how isolation can be achieved for a greater part of the train vibration spectrum by lowering the natural frequency of the isolation system. This SDOF approach has and continues to be used as the basis of analysis for adopting base isolation, even today.
5.5 MDOF Base Isolation models
Cryer (1994) provides a detailed MDOF model of a two dimensional infinite building and its piled foundations, which confirmed a need to utilise MDOF models for evaluating response of base isolated buildings.
Simpler MDOF models also demonstrate this need. Newland (1989) showed that axial modes (j = 1 to ¥ ) of a concrete column, are simply a function of the length of the column (L), and its material properties; Young’s modulus (E) and density (r):
![]() Fixed - Free Columns
Fixed - Free Columns
![]() Free - Free Column
Free - Free Column
These equations could be alternatively expressed, substituting Vc=Ö E/r , the compression wave propagation velocity, a parameter which is easily measured on site. It is significant to note that the axial modes of a bar are independent of the cross sectional dimensions, and therefore this is not a variable that the designer can alter with effect.
Column models created in Ansys were subjected to harmonic support motion to obtain their frequency response. A modal damping ratio of 5% critical was assumed for all modes. Figure 5.9 shows the transmissibilities from the support point to the top and base of an isolated column, modelled as a simple bar, along with the response of a column model loaded with lumped masses at each storey height to represent floor loading. The axial modes of the lumped mass column model are more numerous than those achieved using a simple bar model. The shortcomings of a 'rigid mass model' described by the SDOF representation on this graph is self-evident.
The transmissibilities for an un-isolated and isolated lumped mass column model are shown in Figure 5.10. For the un-isolated column, we see that at high frequencies, the top of the column enjoys lower levels than the input at the base.
The isolated column shows deep anti-resonances at the base, although only troughs are seen at the top, This is because the base becomes a node for a fixed-free mode and therefore hard to excite, whereas the response at the top of the column becomes the anti-node of the fixed-free modes. In this example, the isolated column responds more than the un-isolated column around 20 Hz, corresponding to the free-free mode, which exists in the base isolated case.
The transmissibilities will be dependent upon the magnitude and nature of damping assumed. For example, we can show how the use of these Rayleigh damping constants can yield diverse results. Figure 5.11 shows the use of alpha damping to achieve 5% critical damping ratio at the first modes for each isolated and un-isolated column, with beta damping assumed as zero. Note that all modes have constant bandwidth. Clearly the higher frequencies are now less damped, and the isolated column responds more than the un-isolated column at many more frequencies. The opposite situation occurs when beta damping is applied assuming 5% critical damping ratio at the first modes, with alpha damping as zero. Modal bandwidth increases in proportion to frequency squared (see Newland, 1989). Figure 5.12 shows this case, where the higher frequency modes are excessively damped.
5.6 Modal Density
The number of resonant modes that exist within the frequency range of interest (modal density) is suggested as relevant. A larger structure is likely to exhibit more modes than a smaller structure, in a given frequency range, as seen by the simple example shown in Figure 5.13. This also implies that analysis of a limited part of a structure for economy may lead to expectation of deep troughs between resonance modes, whereas in reality the more extensive structure would show up many more modes that would detract from this.
When evaluating modal density, it is a matter of engineering judgement to decide whether particular modes in a given frequency range are of real interest. For example resonant response of a parapet wall is likely to be less significant than a floor or frame resonance.
5.7 Dynamic Vibration Absorber
It is interesting to note the particular features of a Dynamic Vibration Absorber (Frahm, 1909). A SDOF system in resonance could lead to unacceptable motion (dotted line of Figure 5.14). It was found that the attachment (using the same natural frequency) of a smaller 'absorber' mass via a resilient element to the main mass spring system, would lead to a reduction in the resonant response of the main mass at the original SDOF resonance frequency. This occurs at the expense of higher motion of the absorber mass. Figure 5.14 shows the behaviour of the main mass and the absorber mass, which both individually have a natural frequency of 10Hz, and the mass ratio (absorber/main mass) is 0.1, modelled using Ansys. We can see that both the main mass and the absorber mass together exhibit two resonance frequencies, above and below the natural frequency of the individual systems. At these new resonance frequencies, the response is greater than unity for both, although the absorber mass responds more strongly than the main mass. However, crucially at the original natural frequency of the individual system, the response of the main mass is around zero (for this mass ratio), at the expense of higher motion of the absorber mass. The mass ratio is a critical parameter, and as this is reduced, the two resonance peaks gradually move together, and the effectiveness of the dynamic vibration absorber at the original natural frequency of the system gradually diminishes.
Another consequence of this (2 DOF) arrangement is that the absorber mass would on the other hand benefit from greater isolation compared to the main mass at higher frequencies, a principle, which could be used for isolation of sensitive equipment.
In fact, the name 'absorber' mass is unfortunate as there is no absorption of energy at all, but where the spring force of the absorber mass is at all instants equal and opposite to the applied dynamic force. This means that there is no net force to excite the main mass when the disturbing frequency matches the natural frequency of the original system.
It is possible for a base isolated system to exhibit characteristics displayed by the unique conditions of a Dynamic Vibration Absorber, dictated by the matching natural frequency and mass ratio. For example a floor could represent the absorber mass, whereas the walls of the structure on the isolators could represent the main mass. A hypothetical Base Isolated building was modelled in Ansys, with a rigid body mount frequency of 21Hz set to match the floor natural frequency. The results are shown in Figure 5.15, where we see the floor and the wall exhibit two natural frequencies straddling the original system frequency, and the floor responds strongly at the expense of reduced motion of the wall at the original mount frequency. Cryer (1994) showed that a lack of correlation in the inputs might prevent the floors acting as a dynamic vibration absorber.
5.8 Transient Pulses
Train vibration waveforms are known to contain transient pulses, which can arise for example due to impacts at joints. It is therefore interesting to examine the response of a system to transient pulses, which was investigated using the response of a single degree of freedom system described in Diagram 5.2, subject to transient support motion. The Ansys FE program with the finite difference time domain solution was adopted for this analysis (convergence of solution is a program criteria that was met).
Figure 5.16(a) shows the response of a SDOF system to a half sine pulse (peak 1.5 times greater than input) and Figure 5.16(b) a full sine pulse (peak 2.87 times greater than input), when the pulse period matches the natural period with 3% critical damping ratio. The response magnitude will depend upon the level of damping (increasing as damping reduces) and the relative size of the pulse period in relation to the natural period.
Most transient impulses seen in ground vibration records from railways, when they are clearly distinguishable generally show a transient pulse, which can be modelled as a full sine pulse. It is significant to note that a full sine pulse achieves almost double the response of the half sine pulse.
The effect of the pulse period in relation to the natural period is shown in Figure 5.17. Here the effects of various pulse periods are shown, for cases longer than the natural period, at the natural period and shorter than the natural period.
The results of the ratio of peak response amplitude to peak input are shown in Figure 5.18, along with the steady state response of an identical SDOF system. The response of the SDOF system at its natural frequency due to a transient pulse is less than the steady state response, and significantly the degree of isolation is much less at higher frequencies. It is therefore important to model the inputs to a base isolated building appropriately, and clearly a steady state solution will not always be appropriate.
5.9 Starting Transients / Steady State Response
Vibration analysts often concentrate on a steady state solution, and ignore the initial starting transients assuming that they die away quickly enough to be ignored. There is also an assumption that the excitation is of sufficient duration to induce full magnification at resonance. We can examine if the latter assumption is valid in the analysis of buildings subjected to vibration from railways.
An acceleration time history was taken from a free-field position above an underground railway tunnel (from case study 1- Chapter7). The equation of motion of a SDOF system was again solved using the Ansys Finite Difference Method, which allows a time domain solution. The inputs were taken using the displacement time history (solid line in Figure 5.19(a) obtained by integration of the original acceleration record). The train event exists for 12 seconds, and a 'hanning' window was applied to the displacement time history to obtain zero end conditions.
The analysis was run in time increments of 1/2560s, matching the original sampling rate. Figure 5.19 (a) shows the input derived using site data (solid line) and response (dashed line) of a SDOF system. We can see that the system responds more strongly at its natural frequency, selected to match the natural frequency of a base isolated building using coil springs (from Case Study 1 - Chapter 7, with fn = 4.2Hz and 3% critical damping ratio).
The total and direct transmissibilities (see Chapter 6) were then computed and shown in Figure 5.20 for the response of SDOF systems with a natural frequency of 4.2Hz and 20Hz, with identical damping and subjected to the same input motion. The response of identical SDOF systems to harmonic support motion are also shown. The response magnitude of the lower frequency system is less than the steady state solution, although the results are almost identical for the higher frequency system.
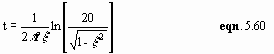
This difference may be due to the effect of time that is needed to build up full resonant response, which is described by Newland (1989) and Grootenhuis (1989). Newland (1989) provides a simple relationship for the time for resonant oscillations to build up to 95% of its final amplitude as a function of natural frequency (f) and critical damping ratio (x ) reproduced here in eqn. 5.60.
![]()
Grootenhuis (1989) showed that for a typical natural frequency and damping of a floor, there would be sufficient time (cycles) in the vibration excitation from a train to induce full resonant response. Indeed using an actual time history of train vibration, this is proved. However it is significant to note that for low natural frequency systems, this is not the case in Figure 5.20. The shape of the response in the immediate neighbourhood of the natural frequency, using the actual time history as input, does not fall entirely below the steady state solution. The difference in shape may be due to the steady state solution being the response of a SDOF system to pure tones, whereas the actual time history contains a mixture of frequencies that arise together.
Figure 5.21 compares the predicted response of a SDOF system using the Ansys time domain solution of the actual time history input, for input measurements below an isolator, from Case Study 1 (Chapter 7), along with the measured transmissibilities across the isolators. The similarity between the shape and size of this theoretical prediction in the region of resonance is seen to be much better than the steady state solution. The position of the peak in this case does not however match the actual natural frequency achieved on site.
We should however note that the spectra are produced using an effective bandwidth of 1.79Hz, and this can lead to a frequency resolution bias error (see Chapter 6). This will cause a resonance to broaden and flatten. We should also note that the input displacement shows strong low frequency components that may have influenced the results. A further examination of this aspect was not pursued.
5.10 Wave Interaction
It has been assumed that the basic physics of passive isolation is applicable to a base isolation situation. We must recognise however that incoming vibration waves will interact with the foundation in a frequency dependent way, being reflected, refracted and transmitted according to the impedance mismatch between the materials of the soil and the concrete. A similar situation will arise at the junctions between the concrete of the foundation/ the isolator material/ and into the material of the structure above. This may arise due to changes of material, but also cross section. Their effects depend upon the wave type. These mechanisms are clearly not accounted for in the SDOF theory that has been described. Cremer and Heckl (1972) indicate that changes in cross section are not very significant, although a drastic change in acoustic impedance owing to change in material properties can reflect a significant fraction of incident energy, although these effects have been investigated at frequencies above 100Hz, in the context of structure borne sound attenuation. Clearly a complete understanding of the performance of base isolated buildings, particularly in the context of ground borne noise can only come from consideration of this aspect as well.
5.11 Conclusions
MDOF models show dynamic response of the structure itself severely compromise the benefits that can be evidenced from a SDOF approach. Column models, with lumped masses per storey height to represent floor loading present a reasonable alternative to SDOF models for framed buildings. Modal density was introduced as a relevant factor. The nature and magnitude of damping were shown to be critical in any evaluation. A dynamic vibration absorber system may in principle arise in a base isolated building, depending upon the matching of natural frequency, mass ratio achieved, although regard to correlation of inputs may be necessary. There are significant differences between transient/steady state response, which may be relevant, and time to build up resonance may need consideration in low damping low natural frequency systems.